Below is a real Rival Report. The team and player names have been masked, but every stat, table, and matchup read came out of an actual game-by-game data set a coach uploaded. This is the exact format every Rival Report follows.
What a coach gets
12U Travel · Chi-Town Bombers 12U · 5-game sample
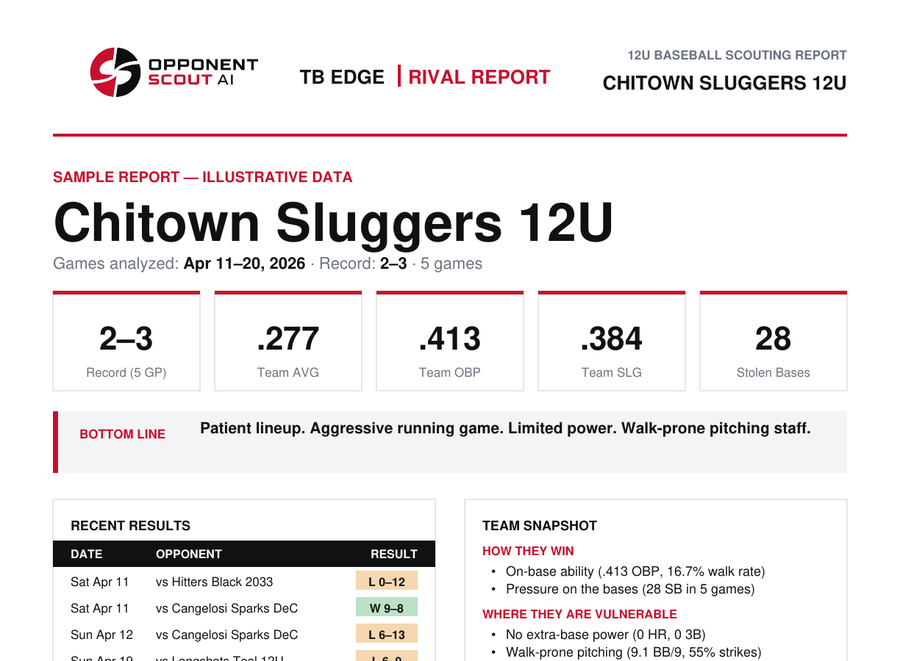
- Cover page with the record, run differential, team OPS, team ERA, and team walk rate up top, plus a one-paragraph Bottom Line read on how this opponent plays the game.
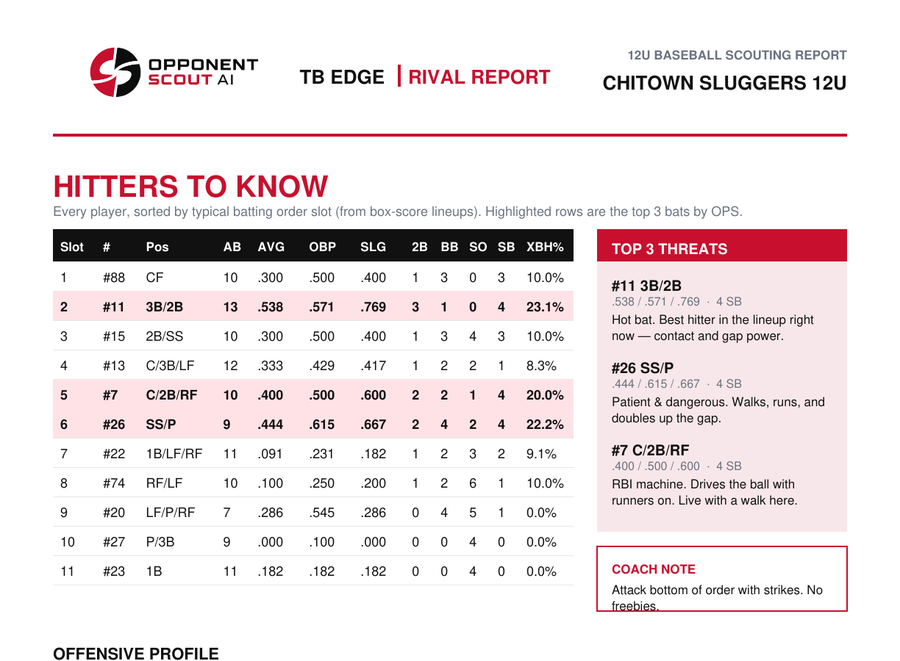
- Hitters to Know with the full lineup ranked by typical batting-order slot, plus a Top 3 Threats sidebar that calls out who you have to actually pitch around.
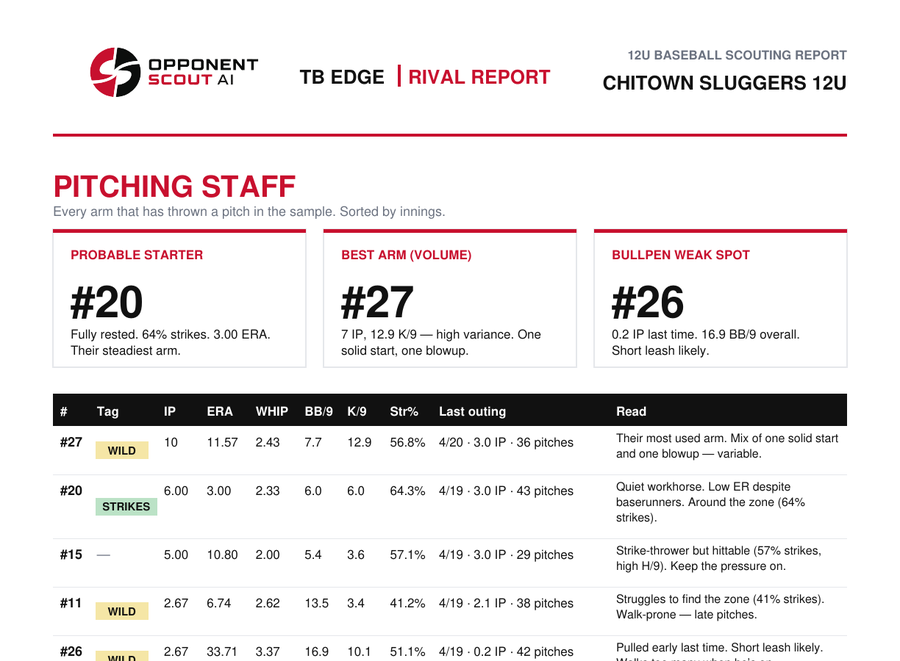
- Pitching Staff with Pitch Smart staff availability for your target game date (who you can't face, who's fresh, who's been used heavily), plus per-pitcher reads (ACE, STRIKES, WILD, HITTABLE, WORK HORSE, STARTER).
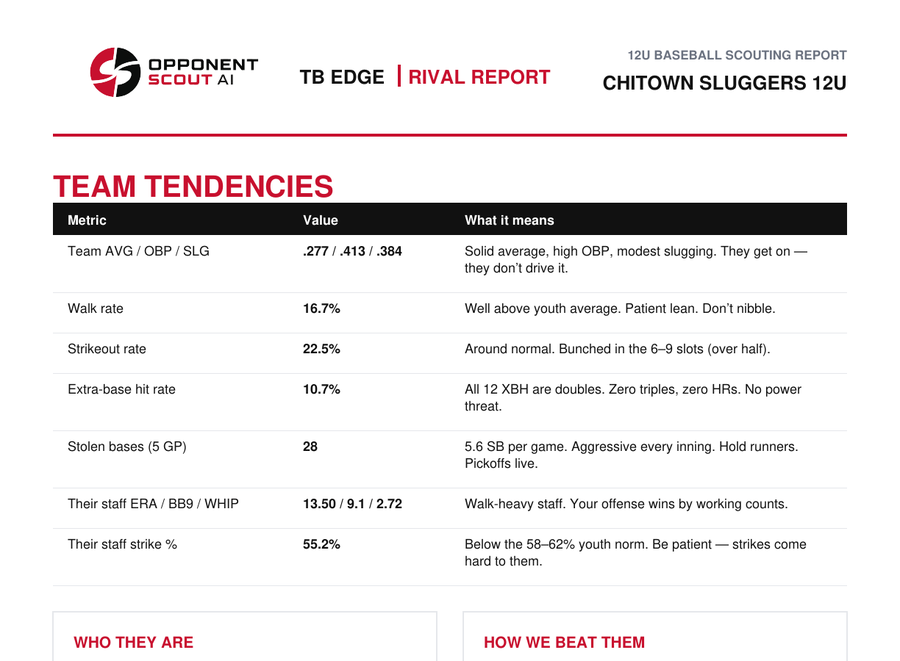
- Team Tendencies translating plate discipline, strikeout rate, power profile, running game, staff control, and staff strikeouts into "what it means for you" plain-English reads.
- Dugout Card with four quadrants (At the Plate, On the Mound, Running Game, Bottom Line) plus a compact combined hitter and pitcher roster you can tack to the fence.
Privacy by design. Opposing-player names are never shown on a Rival Report — every player is referenced by jersey number only. Names get hashed on ingestion so we never store them in plain text. The names you see in the sample below are the masked stand-ins for the real team and coach.